
Deregulation of mitochondrial reverse electron transport alters the metabolism of reactive oxygen species and NAD+/NADH and presents a therapeutic target in Alzheimer's disease
 0
0Abstract
Aim: Oxidative stress and NAD+/NADH imbalance caused by alterations in reactive oxygen species (ROS) and NAD(H) metabolism are pathological features associated with normal aging and age-related diseases including Alzheimer’s disease (AD). How abnormalities in ROS and NAD(H) metabolism occur under these pathological conditions is not well understood, nor is it known whether they are mechanistically linked and can be therapeutically targeted together. The aim of this study is to identify the cause of aberrant ROS and NAD(H) metabolism and test its role in the pathogenesis of AD.
Methods: Reverse electron transport (RET) along mitochondrial complex I can occur under certain thermodynamic conditions, leading to excessive ROS generation and NAD+ conversion to NADH, and thus lowered NAD+/NADH ratio. Brain samples from AD patients and mouse AD models were used to assess the status of RET by measuring ROS and NAD+/NADH ratio in brain lysates and purified mitochondria respiring under RET conditions. A small molecule RET inhibitor was used to treat APP(swe)/PS1(deltaE9) and 5xFAD mouse models and human induced pluripotent stem cell (iPSC)-derived neuronal model of AD. Effects on behavior and AD-related neuropathology were examined. The biochemical mechanism underlying RET alteration was examined by protein-protein interaction studies.
Results: RET is aberrantly activated in transgenic AD mouse brains and in individuals with AD. Pharmacological inhibition of RET reduced amyloid burden and neuroinflammation and rescued cognitive and behavioral deficits in the APP(swe)/PS1(deltaE9) and 5xFAD mouse models. In human AD iPSC-derived neurons, RET inhibition reduced amyloid aggregation, tau hyperphosphorylation, and early endosomal defects. Mechanistically, the
Conclusion: RET is aberrantly activated in AD, causing altered ROS and NAD+/NADH metabolism. Pharmacological inhibition of RET is beneficial in mouse and human iPSC models of AD. RET activation represents a key pathological driver and a rational therapeutic target for AD and possibly other age-related neurodegenerative diseases.
Keywords
INTRODUCTION
Oxidative stress due to increased reactive oxygen species (ROS) production[1-4] and metabolic derailment due to altered NAD+/NADH ratio or lowered NAD+ pool[5-9] are pathological features associated with normal biological aging and age-related diseases. Therapeutic interventions targeting ROS and NAD+/NADH metabolism individually have been tried in the context of aging and age-related diseases, but with mixed results[10-14], highlighting the importance of in-depth understanding of the sources and pathophysiology of ROS and NAD+/NADH metabolism. The mechanisms by which the increased ROS production and decreased NAD+/NADH ratio occur are not well understood, and it is not known if these two processes are connected mechanistically and therefore can be therapeutically targeted together.
Mitochondria have long been recognized as a major source of ROS during aging and age-related diseases[15] and a leading cause of aging based on the free radical theory[16]. Recent studies indicate that the role of ROS in aging and age-related diseases is likely to be complex and multifaceted, with the sites and levels of ROS generation having a significant influence on the outcome[17,18]. It is generally assumed that transient and moderate levels of ROS may serve physiological roles such as stress adaptation and synaptic signaling, whereas prolonged and elevated ROS production can be detrimental. Along the electron transport chain, complex I and complex III have been identified as key sites of ROS generation[19,20]. In certain tissues and under certain respiration conditions, complex I has been shown to be the major site of ROS production[21,22]. Although both beneficial and detrimental effects have been attributed to complex I-generated ROS[23], in general, longevity is associated with a low rate of ROS generation[21].
Mitochondria are also critically involved in NADH/NAD+ metabolism. The central roles of NAD+ and NADH in the TCA cycle and electron transport chain (ETC) underscore the importance of balanced NAD+/NADH to mitochondrial well-being[24]. Beyond this metabolic function, NAD+ critically regulates the activities of NAD+-consuming enzymes, including Sirtuins and poly-ADP-ribose polymerases, which have been implicated in aging and age-related diseases[7,25-27]. NAD+/Sirtuin signaling modulates longevity through the activation of mitochondrial stress responses such as the unfolded protein response (UPRmt) and the nuclear translocation and activation of Foxo[28], linking mitochondrial metabolism and stress signaling with longevity. NAD+ level declines with age, and replenishing NAD+ with precursors offers certain beneficial effects towards aging and age-related disease[6,8], but the long-term health benefits of NAD+ precursor supplementation remain to be tested. Although CD38/157 ectoenzymes have been implicated in NAD+ degradation during aging[24], the causes of NAD+ level decline during age are incompletely delineated and other mechanisms remain to be identified.
Under certain thermodynamic conditions, reverse electron transport (RET) along mitochondrial complex I can occur[29,30], resulting in NAD+ conversion to NADH and thus reduced NAD+/NADH ratio and excessive ROS generation[31-34]. RET is considered a major source of mitochondrial ROS production. While the physiological function of RET remains to be deciphered[35], deregulation of RET has been linked to pathological conditions, e.g., ischemia-reperfusion injury during stroke[32] and cancer[33]. Given that RET influences ROS and NAD+/NADH ratio, two parameters intimately linked to aging and age-related diseases, deregulation of RET is potentially a driver of these pathological conditions. Indeed, simultaneous restoration of tissue ROS and NAD+/NADH homeostasis by inhibition of RET has been explored in the context of aging and age-related diseases and shown to be beneficial in Drosophila models[33,34]. Whether RET is altered in human disease conditions and the in vivo efficacy of RET manipulation in mammalian models of age-related neurodegenerative diseases such as AD are important questions that remain to be tested. CPT2008,
MATERIALS AND METHODS
Animals
The following flies were obtained from the Bloomington Drosophila Stock Center: white (3605), elav-GAL4 (8765), UAS-APP.C99 (33783), UAS-APP;UAS-BACE (33798). The sources of the other fly stocks are as follows: Dr. Troy. Littleton (MHC-GAL4). The indicated UAS RNAi and OE fly lines were crossed to
All procedures related to the handling, care, and treatment of mice in this study were performed according to guidelines approved by the Institutional Animal Care and Use Committees (IACUC) of Pharmaron and Stanford University following the guidance of the Association for Assessment and Accreditation of Laboratory Animal Care (AAALAC). The APP(swe)/PS1(delta E9) (2xTg) mice were purchased from SPF Biotechnology Co., Ltd. Twenty-four female mice at 7 months of age were used in the study performed at Pharmaron. Animals were quarantined for 7 days before the study. The general health of the animals was evaluated by a veterinarian, and complete health checks were performed. The animals were kept in an IVC environment at constant temperature and humidity with 3 animals in each cage. Animals were housed in well-ventilated rooms maintained at a temperature of 22 ± 3 °C and relative humidity of 40%-80%. Fluorescent lighting provided illumination for approximately 12 h per day. The bedding material was corn cob, which was changed once per week. Each animal was assigned an identification number. Animals had free access to irradiation sterilized dry granule food (Beijing Keaoxieli Feed Co., Ltd., Beijing, China) during the entire study period. Sterile drinking water in a bottle was available to all animals ad libitum during the quarantine and study periods. The bottle and the stopper with attached sipper tube were autoclaved prior to use. Samples of water from the animal facility were analyzed and the results of water analysis were retained in the facility records and reviewed by the veterinarians. Based on body weight, APP/PS1 mice were randomly assigned to two groups. The G1 (vehicle) group (n = 12) was dosed once daily with vehicle at
5xFAD mice [B6SJL-Tg(APPSwFlLon,PSEN1*M146L*L286V)6799Vas/Mmjax; Strain#034840-JAX] were ordered from Jackson Laboratory. After the mice were received from the vendor, they were kept in the animal facility of Stanford University School of Medicine and bred to wild-type mice to obtain enough animals for the planned experiments. Animals were housed in groups of up to 3 per cage and maintained as colonies at the Stanford University Animal Facility. Food and water were available ad libitum, and the cage contained shredded paper bedding as standard housing. Animals were kept on a 12-h light/dark cycle (lights on at 6:00 h), and the room temperature was controlled via a thermostat set at 21 °C. No obvious differences between male and female mice were observed and we used both male and female mice for the present studies. All animal experiments were performed in accordance with the protocols approved by the Administrative Panel on Laboratory Animal Care (APLAC) at Stanford University and comply with all regulations for the ethical conduct of animal research. For the CPT treatment of 5xFAD mice, 6-month-old animals equally divided into two groups based on sex and body weight (n = 10 in each group) were treated with vehicle or CPT at a dose of 50 mg/kg body weight, by daily i.p. injection for 2 months. In a subset of studies, 9-month-old 5xFAD animals were treated with vehicle or CPT for 2 weeks before tissue collection for RET analysis.
Pharmacokinetic studies
Plasma collection
Whole blood was collected into 1.5 mL EDTA anticoagulant centrifuge tubes and centrifuged at 4,000 g for 5 min at 4 °C to separate the plasma at 1 h post dosing. All samples were stored at -80 °C and later used for pharmacokinetics (PK) and ROS and NAD+/NADH measurements.
The desired serial concentrations of working solutions were achieved by diluting the stock solution of analyte with 50% acetonitrile in water solution. 5 µL of working solutions (1, 2, 4, 10, 20, 100, 200, 1,000, 2,000 ng/mL) were added to 10 μL of the blank female C57 mouse plasma to achieve calibration standards of 0.5~1,000 ng/mL (0.5, 1, 2, 5, 10, 50, 100, 500, 1,000 ng/mL) in a total volume of 15 μL. Five quality control samples at 1, 2, 5, 100 and 800 ng/mL for plasma were prepared independently of those used for the calibration curves. These QC samples were prepared on the day of analysis in the same way as calibration standards. 15 μL standards, 15 μL QC samples, and 15 μL test samples (10 µL plasma + 5 µL blank solution) were each added to 200 μL of acetonitrile containing IS mixture for protein precipitation. Then, the samples were vortexed for 30 s. After centrifugation at 4 °C, 4,000 rpm for 15 min, the supernatant was diluted
Tissue collection
Heart, liver, uterus, lung, kidney and tail were collected and transferred to -80 °C freezer. Brain samples of all animals were collected and divided into two hemispheres. Brain samples of G1-2 (n = 3) and G2-2 (n = 3) were snapped in N2 and fixed in 10% neutral buffered formalin for IHC or IF staining, and the remaining samples were transferred to the -80 °C freezer.
The liver, kidney, heart, lung, and brain samples were added with water by tissue weight (g) to 50% methanol 50% water volume (mL) ratio 1:5 for homogenizing. The uterus samples were added with water by uterus weight (g) to 50% methanol 50% water volume (mL) ratio 1:9 for homogenizing. The desired serial concentrations of working solutions were achieved by diluting the stock solution of the analyte with 50% acetonitrile in water solution. 15 µL of working solutions (1, 2, 4, 10, 20, 100, 200, 1,000, 2,000 ng/mL) were added to 30 μL of the blank female C57 Mouse tissue homogenate to achieve calibration standards of 0.5~1,000 ng/mL (0.5, 1, 2, 5, 10, 50, 100, 500, 1,000 ng/mL) in a total volume of 45 μL. Five quality control samples at 1, 2, 5, 100, and 800 ng/mL for tissue homogenate were prepared independently of those used for the calibration curves. These QC samples were prepared on the day of analysis in the same way as calibration standards. 45 μL standards, 45 μL QC samples, and 45 μL unknown samples (30 µL tissue homogenate with 15 µL blank solution) were each added to 200 μL of acetonitrile containing IS mixture for protein precipitation. Then, the samples were vortexed for 30 s. After centrifugation at 4 °C, 4,000 rpm for 15 min, the supernatant was diluted 3 times with water. 20 µL of diluted supernatant was injected into the LC/MS/MS system for quantitative analysis of kidney, heart, and lung samples. 10 µL of diluted supernatant was injected into the LC/MS/MS system for quantitative analysis of liver, brain, and uterus samples.
Behavioral studies
The behavioral assays were performed in the order described below, with one-week interval between the first three assays - Morris water maze, Y maze, and passive avoidance, and two-day interval between the remaining tests, to avoid assay related stress on behavioral outcome.
Morris water maze test
The Morris water maze pool was conceptually divided into quadrants. A transparent platform was then placed in one of the pool quadrants and submerged 1 cm below the water surface at 22 ± 2 °C. Mice were given four training trials per session per day in the presence of the platform during training. Each mouse was placed at one of the starting points facing the wall and released into the pool. The escape latency was recorded from the starting point to the point of finding the hidden platform and analyzed using video recording. If the mouse failed to find the platform within 60 s, the escape latency was recorded as 60 s. Each mouse was manually guided to the platform to strengthen memory for 20 s. The spatial probe test was carried out on the 8th day. During the probe trial, the underwater platform was removed, and each mouse was allowed to swim freely for 60 s. The times of platform crossing, latency to the platform, average swimming speed and distance in the target quadrant were recorded for 30 and 60 s and analyzed by using the XR-Supermaze software.
Y maze test
Each mouse was placed at the center of the Y maze apparatus and allowed to move freely through the maze during an 8-min session. The number of arm entries was videotaped via the Hikvision video system. Alternation was defined as successive entry into the three arms on overlapping triplet sets. The alternation behavior (%) was calculated as the ratio of actual alternations to possible alternations (defined as the number of arm entries minus two) multiplied by 100.
Passive avoidance test
Passive avoidance consisted of a training trial on the first day and a retention test 24 h later. On the training day, each mouse was placed in the illuminated compartment, with the door between the two chambers kept open. After an acclimation period of 300 s, the mouse was taken out of the chamber and put back into the illuminated compartment. An electrical stimulation of 0.5 mA for 3 s to the feet was followed when the mouse entered the non-illuminated compartment. After 24 h, the mouse was put in the illuminated compartment and the time required for the mouse to enter the non-illuminated compartment after the door had been opened was defined as the latency. The latencies were recorded for up to 300 s by using the XR-Superpas software.
Hindlimb clasping test
The mice were removed from their cage and suspended by the tail for 5-10 s. The hind limb clasping phenotype was scored on a scale from 0-4 and then assigned a score based on the following criteria. Score 0: No limb clasping. Normal escape extension. Score 1: One hind limb exhibits incomplete splay and loss of mobility. Toes exhibit normal splay. Score 2: Both hind limbs exhibit incomplete splay and loss of mobility. Toes exhibit normal splay. Score 3: Both hind limbs exhibit clasping with curled toes and immobility. Score 4: Forelimbs and hind limbs exhibit clasping and are crossed, curled toes and immobility. All mice were scored by two independent investigators. Any mouse where the two scores differ by more than 1 point was rescored.
Elevated plus maze test
On the day of testing, each mouse was placed individually on the central square of the maze, facing the open arm, and allowed to explore the apparatus for 5 min. The entries into open and closed arms and the time spent on these arms were videotaped and analyzed using the XR-Xmaze software. The degree of anxiety was assessed by calculating the ratio between the number of entries into the open and closed arms, and the ratio between the time spent on open and closed arms.
Open field test
Each mouse was placed singly into the center of the apparatus and allowed to explore for 5 min. The time, number, distance traveled, and average speed of entries into the central zone of the apparatus were all recorded and analyzed automatically. The duration of movement in the out ring and the total distance were tracked and analyzed using the XR-Xmaze software. The number of fecal particles was recorded after each test.
Grip strength test
During this test, the mouse gripped onto a metal grid with four limbs. The grid was attached to a force transducer that measured the pulling force achieved. Subjects were firmly pulled horizontally away from the grid (parallel to the bench) for 3 to 5 consecutive trials with a brief (approximately 30 s) rest period on the bench between trials.
Balance beam test
The beam-walking protocol consisted of 2 consecutive training days and 1 test day. The apparatus was elevated approximately 50 cm off a table surface. Testing was performed in a dark room with a single light directed at the start position of the beam to encourage crossing to the goal box. Mice ran at approximately the same time every day and were habituated to the behavior room for about 15 min prior to the start of training. At the start of the first trial of each day, a mouse was placed into the goal box for approximately
Necropsy
The animals were sacrificed for necropsy at 1 h post dosing and any abnormalities were recorded on a necropsy worksheet by a certified pathologist.
Mitochondrial purification
Intact mitochondria from in vitro human cells and animal or human tissues were purified and quality controlled for the absence of contamination by other organelles according to established procedures. For analysis of fly samples, male flies at appropriate ages were used for thoracic muscle dissection. Samples were homogenized using a Dounce homogenizer. After two steps of centrifugation (1,500 g for 5 min and
Mitochondrial ROS and NAD+/NADH measurements
NAD+/NADH was measured essentially as described, using an NAD+/NADH quantification colorimetric kit according to the manufacturer’s instructions (AAT Bioquest #15273). Briefly, cell pellets or tissue samples were lysed using the lysis buffer for 15 min at 4 °C and lysates were collected after centrifugation at 12,000 g for 15 min. For the measurement of total NAD+ amount, NAD extraction solution into the lysates was added and incubated at 37 °C for 15 min; thereafter, neutralization solution was added to neutralize the NAD extracts. Absorbance was monitored at 460 nm after adding NAD/NADH working solution and 1 h incubation at room temperature with protection from light. To measure the total NAD+ and NADH amount, control extraction solution was added to the lysates and incubated at 37 °C for 15 min; thereafter, again, control extraction solution was added. Absorbance was monitored at 460 nm after adding NAD/NADH working solution and 1 h incubation at room temperature with protection from light. The ratio of NAD+/NADH was determined by the following equation: ratio = NAD (total) - NADH/NADH. Each experiment was performed at least 3 times.
Mitochondrial ROS was determined by monitoring the oxidation of Amplex Red by H2O2 in the presence of horseradish peroxidase. Isolated mitochondria were incubated in an assay medium (125 mM KCL, 20 mM HEPES, 2 mM K2HPO4,
In vitro RET and forward electron transport assays
Isolated mitochondria were incubated in an assay medium (125 mM KCl, 20 mM HEPES, 2 mM K2HPO4,
The effects of complex I inhibitor rotenone and succinate dehydrogenase inhibitor dimethyl malonate (DMM) were examined under FET or RET induction conditions. To block FET, 1 µM rotenone was used while 25 nM rotenone was used to block RET. 1 mM DMM was supplemented in the FET or RET conditions.
Succinate assay: mitochondria succinate level was measured using a succinate assay/measurement kit (abcam-ab204718) according to the manufacturer’s instructions.
Immunofluorescence staining
Animals were sacrificed by cervical dislocation and subsequently half of the brain tissues were harvested, followed by storing in 4% formalin (Sigma) for 24 h. Tissues were then moved into 10% sucrose 24 h and 20% sucrose 24 h, respectively. After processing, tissues were embedded with OCT. Ten-micrometer sections were fixed in cold acetone for 10 min, and then air-dried at room temperature for 1 h. To remove OCT, slides were placed in 1XPBS wash buffer for 10 min, followed by processing with 0.3% PBST. After washing with 1XPBS, excess wash buffer was wiped off from slides without drying sections. Tissues were blocked in 5% goat serum for 1 h at room temperature, followed by incubation with primary antibodies for 6E10 (#803001, Bio Legend; 1:500), IBA-1 (NBP2-19019, NOVUS; 1:500), MOAB2 (NBP2-13075, NOVUS; 1:200), C3 (ab97462, abcam; 1:500) and GFAP (mAb #3670, Cell Signaling; 1:200) overnight at 4 °C. Samples were rinsed in wash buffer for 5 min. After wiping off excess buffer, we incubated samples with secondary antibodies (conjugated to fluorophores) in the dark for 2 h at room temperature. After washing with PBS
Western blotting and immunoprecipitation
Around five fly thoraces were homogenized in 75 µL of regular lysis buffer (50 mM Tris-HCl, 150 mM NaCl, 1% Triton X100, protease inhibitors) or Urea lysis buffer (6 M Urea, 50 mM Tris-HCl, 150 mM NaCl, 0.1% Triton X100, protease inhibitors) on ice. Samples were homogenized using a hand-held mechanical homogenizer for 30 secs. The homogenized samples were incubated on ice for 30 min before centrifuging at 15,000 rpm for 20 min at 4 °C. 30 µL of supernatant was mixed with 10 µL of 4× Laemmli sample buffer (BioRad #161-0747) and boiled for 5 min at 100 °C. The protein lysate was cooled, centrifuged, and loaded onto 4%-12% Bis-Tris gel (Invitrogen #NP0321) or 16% Tricine gel (Invitrogen #EC66955) with 1× MES (Invitrogen #NP0002) as running buffer.
Co-immunoprecipitation assays for detecting the effect of aging and drug treatment on protein-protein interaction between C-I proteins were performed essentially following a protocol described before. Briefly, cell pellets or tissue samples were homogenized in the lysis buffer [50 mM Tris-HCl, pH7.4, 150 mM NaCl, 5 mM EDTA, 10% glycerol, 1% Triton X-100, 0.1mg/mL cycloheximide, 1× RNase inhibitor, and Complete protease inhibitor cocktail (cat#: B14012, Bimake)], and additional Phosphatase Inhibitor Cocktail (cat#: B15001, Bimake) will be applied if phosphorylation signal is to be detected. After centrifugation at 10,000 g for 5 min, the supernatant was subjected to immunoprecipitation using the indicated primary antibodies, or affinity gels at 4 °C for 6 h with gentle shaking. In general, 500 µg of total protein was used for co-immunoprecipitation assays. Subsequently, protein A-Sepharose beads were added to the mixture and incubated at 4 °C for 2 h with gentle shaking. The Sepharose beads were washed three times (10 min each) at 4 °C in lysis buffer, mixed with 2× SDS Sample buffer, and loaded onto SDS-PAGE gels for western blot analysis. In general, 1/5 of the immunoprecipitated samples were loaded for western blot analysis. The primary antibodies used were: 6E10 (#803001, BioLegend; 1:1,000), NDUFS3 (ab110246, abcam; 1:1,000), NDUFV1 (gift from Dr. Edward; 1:1,000) and NDUFV2 (gift from Dr. Edward; 1:1,000), actin (Cat#66009-1-Ig, Proteintech; 1:1,000).
iPSC studies
AD iPSC cell lines (UCSD239i-APP2-1 and UCSD234i-SAD2-3) were obtained from WiCell Research Resources (Wicell, WI). UCSD239i-APP2-1 contains duplication of the APP gene. UCSD234i-SAD2-3 is derived from a sporadic AD patient. Normal human ESCs (H1) were gifts from Dr. Marius Wernig at the Department of Pathology, Stanford University School of Medicine. H1 ESCs and AD iPSCs were differentiated according to a protocol previously described[36]. Briefly, ESCs and iPSCs were treated with Accutase and plated as dissociated cells on Matrigel-coated plates using mTeSR1 supplemented with ROCK inhibitor. The next day, cells were transfected with TetO inducible NGN2 lentivirus using polybrene
For immunostaining, cells were washed with PBS, fixed with 4% paraformaldehyde for 15 min, and permeabilized with 0.5% Triton X-100 in PBS for 15 min. After blocking with 3% BSA for 1 h, cells were incubated with primary antibodies at 4 °C overnight. The primary antibodies used were: MAP2 (Cat#17490-1-AP, ProteinTech; 1:500), mOC78 (gift from Dr. Charles Glabe; 1:200), Tau (AHB0042, ThermoFisher; 1:200), CP13 (gift from Dr. Peter Davis; 1:200), and Rab5 (Ab31261, Abcam; 1:1,000). Slides were washed three times with PBST and incubated with fluorescent-dye-conjugated secondary antibodies for 1 h at room temperature. Nuclei were stained with DAPI (10 μg/mL) for 3 min. Images were acquired using a Leica SP8 confocal microscope.
Human samples
Human tissue samples from patients with AD and controls were provided by the University of California at San Francisco (UCSF) Neurodegenerative Disease Brain Bank. The genetic backgrounds of AD patients and control subjects are uncharacterized. Demographic information is provided in Supplementary Table 1. Informed consent to undergo autopsy was provided by patients and/or their surrogates, following the principles outlined in the Declaration of Helsinki. Post-mortem brains were freshly cut according to an interleaved bi-hemispheric coronal slabbing protocol that captures frozen slabs for biochemical/molecular biological analysis. Regional tissue blocks corresponding to the inferior temporal gyrus and/or middle frontal gyrus were cut into frozen sections and used in mitochondrial analysis.
Statistics
Statistical analysis was performed using GraphPad Prism 8 (Windows version 8, GraphPad Software, San Diego, CA, USA). Student’s t test and one-way ANOVA test with Scheffe’s analysis as a post hoc test for comparing two sets of data were used in statistical analyses. All data are represented as mean ± SEM, with
RESULTS
Blood-brain-barrier crossing ability of CPT
To test if CPT can cross the blood-brain barrier in mammals, we performed a PK study in rats. We determined the PK parameters of CPT in the plasma and whole brain of Sprague-Dawley Rats following intravenous and oral administrations [Figure 1A-C]. The brain penetration ability of CPT was assessed through the whole brain PK parameters. Blood samples were collected at 5 min, 15 min, 30 min, 1 h, 2 h,
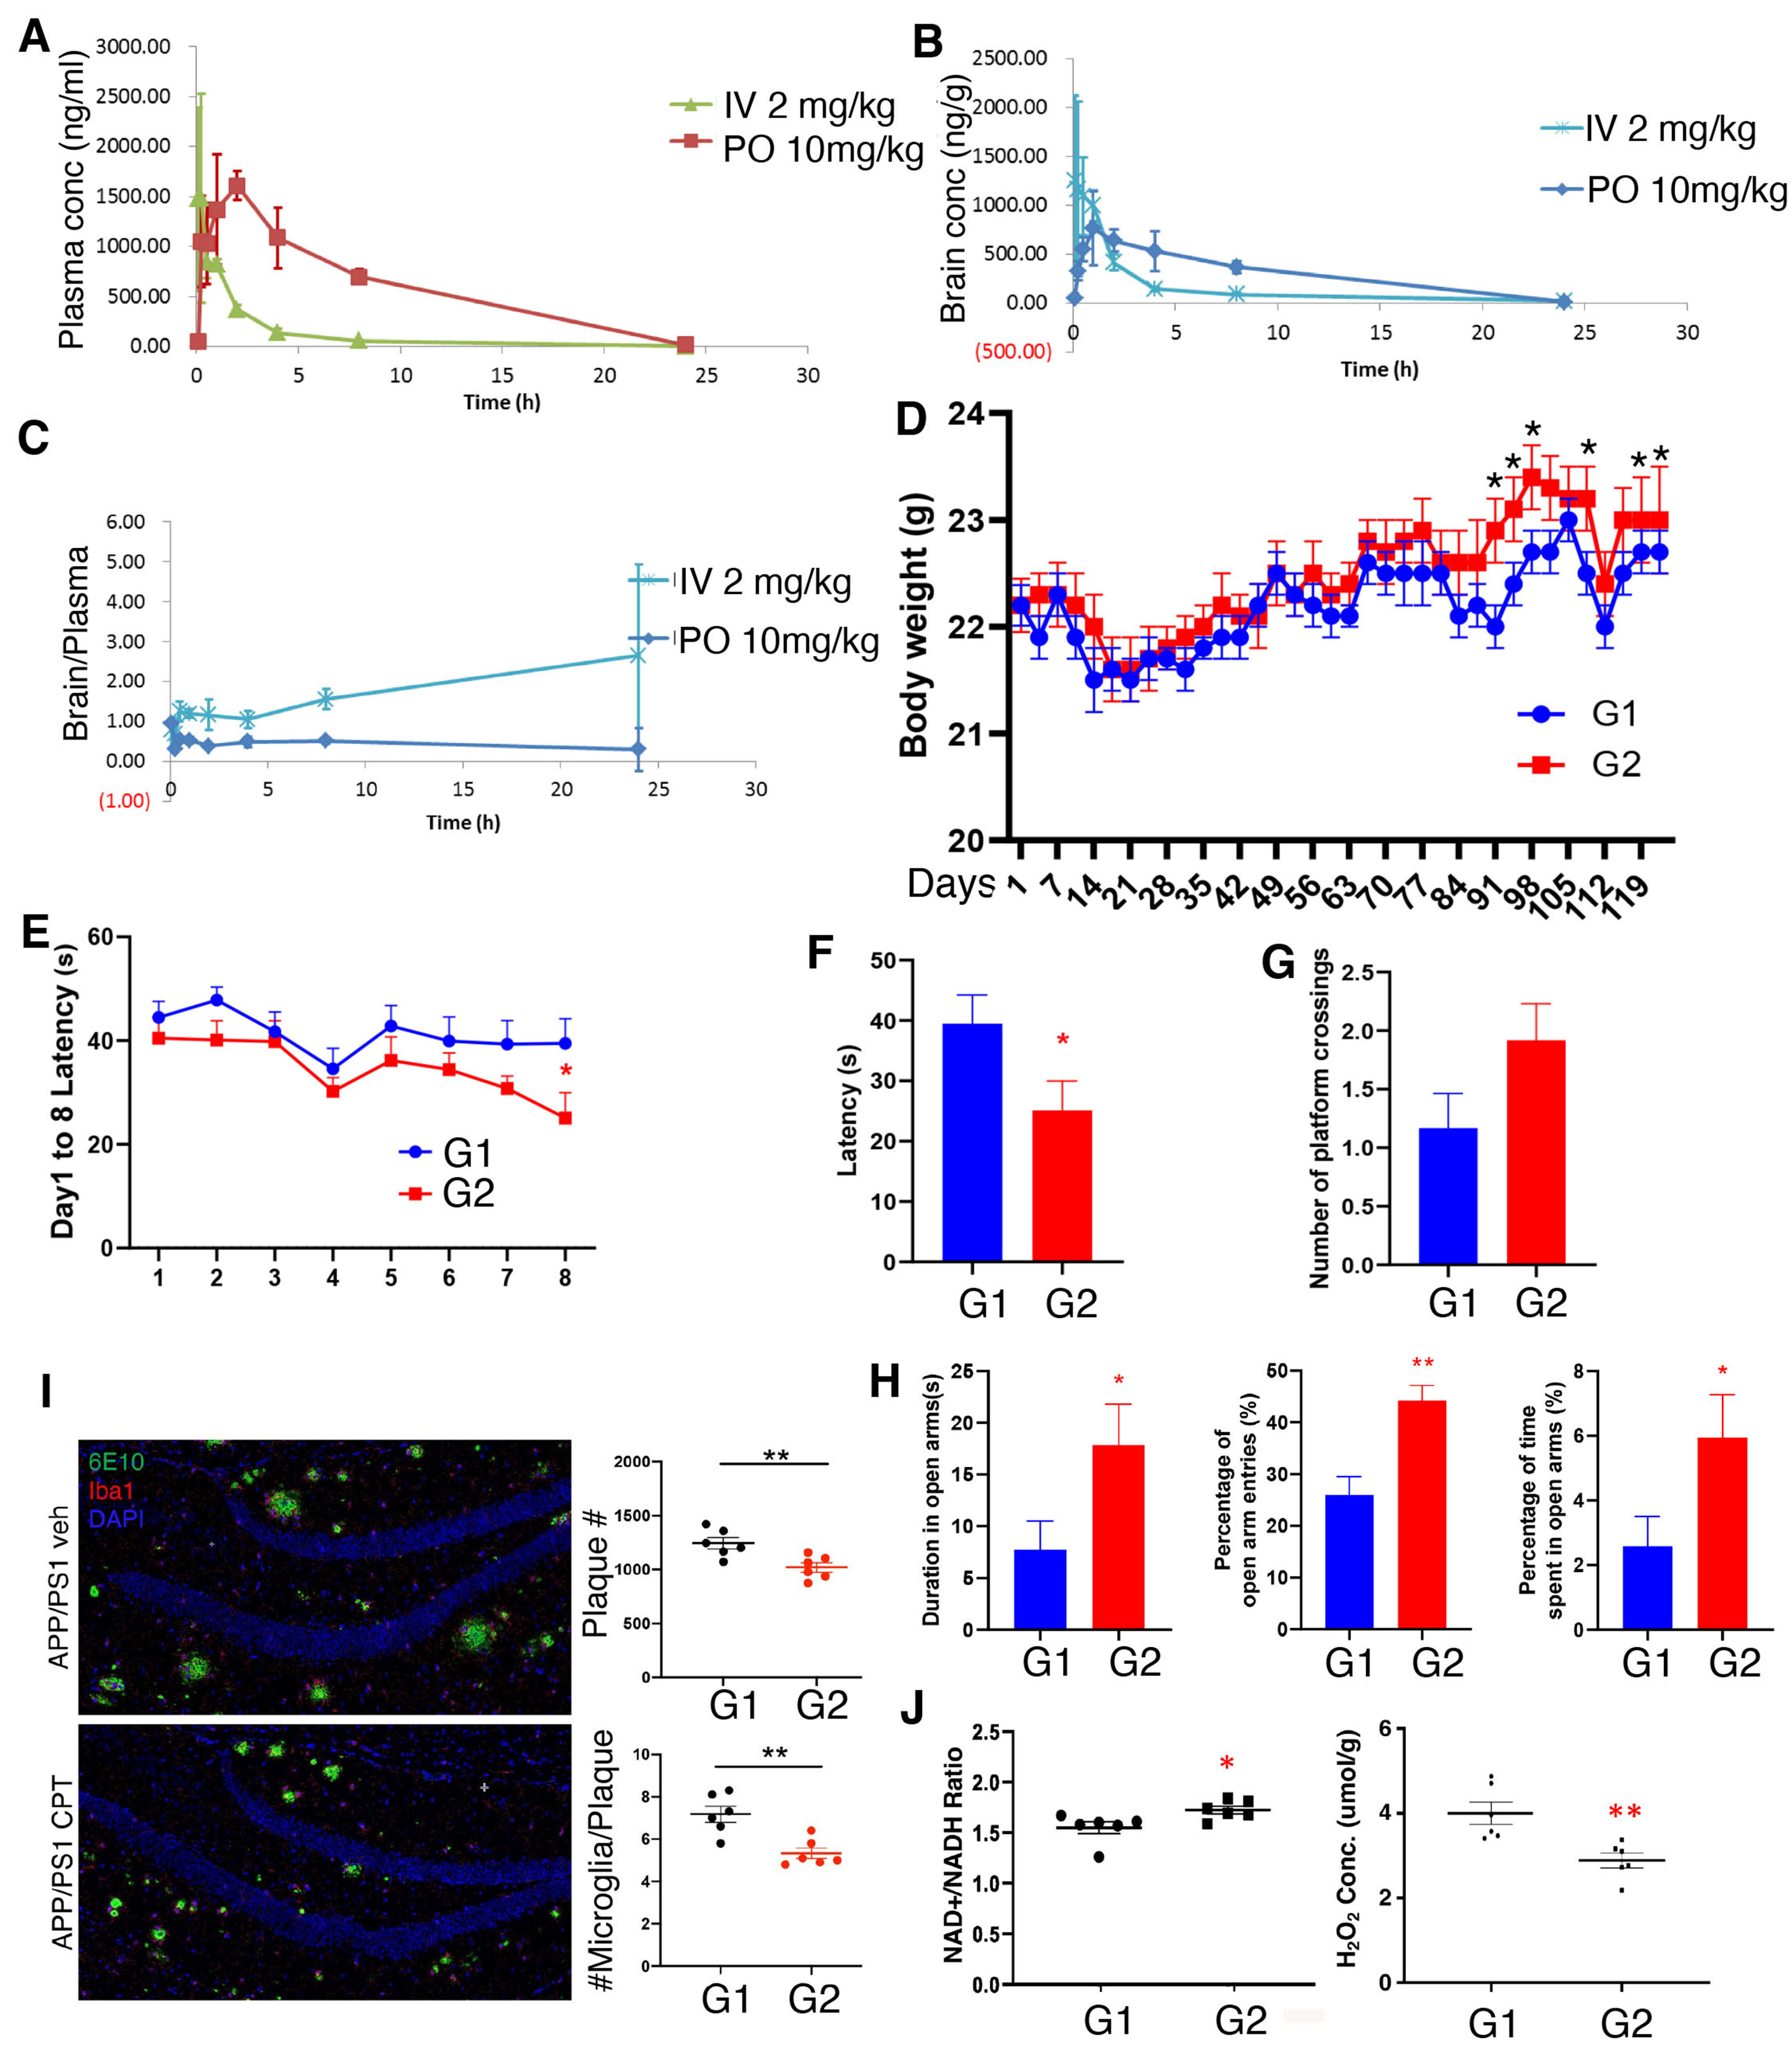
Figure 1. PK analysis of CPT and in vivo efficacy of CPT in the APP(swe)/PS1(deltaE9) 2xTg mouse model of AD. (A-C) Measurements of the plasma (A), brain (B) concentrations, and brain/plasma ratio (C) of CPT at 5 min, 15 min, 30 min, 1h, 2h, 4h, 8h, 24h of post dosing with 2 mg/kg IV or 10 mg/kg PO in SD rats; (D) Body weight measurements of G1 (vehicle) and G2 (CPT-treated) APP(swe)/PS1(deltaE9) mice; (E-G) Latency of G1 (vehicle) and G2 (CPT-treated) APP(swe)/PS1(deltaE9) mice during training sessions (E) or probe trial (F), and number of platform-crossing during probe trial (G) in Morris water maze assays; (H) Measurement of duration in open arm, percent of open arm entries, and percent of time in open arm in the elevated plus maze assay of G1 (vehicle) and G2 (CPT-treated) APP(swe)/PS1(deltaE9) mice; (I) Immunostainings and data quantification showing the effect of CPT treatment on amyloid plaque load and the number of microglia surrounding amyloid plaque in APP(swe)/PS1(deltaE9) mouse brain sections; (J) Measurements of NAD+/NADH ratio and H2O2 level in whole brain lysates of G1 (vehicle) and G2 (CPT-treated) APP(swe)/PS1(deltaE9) mice. *P < 0.05, **P < 0.01 in Student’s t-test or one-way ANOVA test. PK: Pharmacokinetics; CPT: CPT2008, 6-chloro-3-(2,4-dichloro-5-methoxyphenyl)-2-mecapto-7-methoxyquinazolin-4(3H)-one; AD: Alzheimer’s disease.
Efficacy of RET inhibition by CPT in the APP(swe)/PS1(deltaE9) (2xTg) mouse model of AD
To test the effect of CPT on the development of AD-related cognitive deficit and neuropathological features in an in vivo mammalian model, we chose the APP(swe)/PS1(deltaE9) (2xTg) mice. These transgenic mice were made by co-injecting two vectors encoding mutant APP and mutant PSEN1, respectively. They begin to develop Aβ deposits by six months of age, with abundant plaques in the hippocampus and cortex by nine months[37]. Plaques continue to increase up to around 12 months of age[38]. Neuroinflammation develops in parallel with plaque deposition, with severe gliosis starting around six months, especially in the vicinity of plaques[39]. Behavioral deficits in this mouse model have been reported across cognitive domains, though severity and timing depend on the specific assays used[40]. Spatial learning is comparable to non-Tg mice at
Other studies showed that CPT treatment of wild-type animals did not affect cognitive behaviors, suggesting that CPT does not affect memory acquisition in normal animals[33,34]. Therefore, in this study, only 2xTg mice were used to test the therapeutic effect of CPT. Twenty-four 7-month-old 2xTg mice were randomly assigned to two groups (n = 12/group) based on body weight: G1 (vehicle) and G2 (CPT treatment). Vehicle and CPT (100 mg/kg) were administered by oral gavage once daily for 4 months. The 100 mg/kg dose was chosen as previous studies showed that CPT was effective at this dose level in mouse models of neurological disorders[33,34]. Body weights were recorded twice weekly during the study [Figure 1D]. Although the average body weight of the two groups did not differ significantly through most of the study, on days 91, 94, 98, 108, 115, and 119, the body weight of CPT-treated G2 group was significantly higher than that of vehicle-treated G1 group (P < 0.05). No abnormality was seen in either group by cage-side observation during the study.
At the end of the 4-month treatment, animals were subject to a battery of behavioral tests. In the Morris water maze test, in which animals were trained to find a hidden platform during the training period, CPT-treated G2 animals started to show reduced latency to locate the platform on day 5, and the difference between G1 and G2 became significant on day 8 [Figure 1E]. In the probe trial, the difference between the two groups in the latency to find the location of the previous hidden platform was significant [Figure 1F]. The number of platform-crossing also showed a trend of increase [Figure 1G], although the average speed of swimming was comparable between the two groups [Supplementary Figure 1A]. CPT treatment thus specifically improved spatial learning and memory. The passive avoidance test measures the latency to enter a “dark” context, in which an aversive stimulus (foot shock) has been previously experienced, using a light-dark box paradigm. CPT-treated animals showed a trend of increased latency in entering the “dark” box after one trial, although the difference did not reach statistical significance [Supplementary Figure 1B]. The elevated plus maze test is used to measure anxiety-like behavior in rodents. This assay is based on mice’s innate aversion to open spaces, which is manifested as animals spending less time in the open arm and more time in the enclosed arms of the elevated plus maze. The entries into open and closed arms, and the time spent on these arms were measured. The percentage of open arm entries, percentage of time spent in open arms, and duration in open arms were all significantly increased in CPT-treated group [Figure 1H and Supplementary Figure 1C], suggesting that CPT may exert certain anxiolytic activity. Similarly, in the open field test, which is also one of the commonly used ethological tests to assess anxiety-like behavior in rodents, the duration, number of entries, distance traveled, and average speed in the central zone of the apparatus were measured. The CPT-treated group exhibited a trend of increased duration, number of entries, and distance traveled in the central zone, whereas the average speed in the central zone was decreased
Immunofluorescence staining of frozen brain sections with the 6E10 antibody, which recognizes monomeric, oligomeric and fibrillar forms of beta amyloid 1-42 peptide[43], and the ionized calcium-binding adaptor molecule 1 (Iba1) antibody, which recognizes activated microglia[44], showed that the total number of amyloid plaques and Iba1-positive aggregates, and the number of Iba1-positive microglia surrounding each amyloid plaque were all significantly reduced in the CPT-treated G2 group [Figure 1I], indicating that CPT treatment reduced amyloid burden and amyloid-associated neuroinflammation. Increased ROS production and decreased NAD+/NADH ratio are two of the main outcomes of RET, which can be reliably detected at whole tissue lysate level due to the fact that mitochondria are the major sources of these metabolites[33,34]. Brain ROS level was significantly decreased and the NAD+/NADH ratio increased in G2 animals [Figure 1J], supporting the engagement of the RET mechanism by CPT in vivo. We note that the level of H2O2 detected in the 2xTg AD mouse brain was comparable to that detected in the APP Tg AD mouse brain using a similar detection method[45]. Together, these data suggest that CPT treatment inhibited RET and reduced amyloid burden and neuroinflammation in the 2xTg mouse model of AD.
We measured the tissue distribution of CPT at the end of the in-life study. One hour after the final oral dosing, animals were sacrificed, and plasma and various tissues collected. The drug concentrations in plasma, liver, kidney, heart, lung, uterus, and brain were determined [Supplementary Table 3]. The concentrations ranged from 34.9 µM in the lung to 164 µM in the liver. In the brain, the total drug concentration was 46.7 µM, and the brain/plasma ratio was 0.605. We also measured free drug concentration in the brain. The determined free drug concentration (1.06 µM) was very close to the IC50 value of RET inhibition by CPT in in vitro RET assays[34], supporting that CPT was engaging the RET mechanism in vivo to alter the course of disease in the APP/PS1 mouse model. At the end of the in-life study, we performed necropsy on G1 and G2 animals and examined all major organs, including brain, spine, thymus gland, thyroid gland, esophagus, stomach, intestine, liver and pancreas, kidneys, spleen, heart, trachea, lung, uterus, ovary, and mammary glands [Supplementary Table 4]. The observations were unremarkable, except for one animal in the G2 group whose uterine length was abnormal, although it could not be determined if this was treatment-related. These results indicate that long-term (4 months) oral administration of CPT at 100 mg/kg is generally safe in 2xTg AD mice.
Efficacy of RET inhibition by CPT in the 5xFAD mouse model of AD
We also tested the effect of CPT in vivo in other mouse AD models. This would allow us to assess whether the drug is effective in multiple animal models. Considering that none of the animal models is a perfect model for AD, testing multiple models would further support the translation value of our therapeutic approach. The 5xFAD mouse model exhibits early and robust recapitulation of disease-relevant phenotypes[46]. We treated 5xFAD mice at 6 months of age continuously with CPT by daily intraperitoneal (IP) injections at 50 mg/kg for 2 months. The rationale for treating the 5xFAD mice at 6 months of age is that at this age, these mice already exhibit neuropathological features including amyloid plaque formation and neuroinflammation, thus making the CPT treatment more of a therapeutic mode. We found that the 5xFAD mice exhibited increased RET activity in the brain, as measured by ROS increase and NAD+/NADH ratio decrease compared to age-matched non-transgenic animals in whole brain tissue homogenates [Figure 2A]. CPT treatment significantly reduced brain ROS level and increased NAD+/NADH ratio in 5xFAD animals, but not WT control animals [Figure 2A and Supplementary Figure 2A], supporting that RET is induced in transgenic AD brain. To specifically measure mitochondrial ROS and NAD+/NADH ratio changes, we performed in vitro RET or FET assays using mitochondria purified from WT control or 5xFAD animals [Figure 2B]. CPT treatment significantly inhibited RET-related ROS and NAD+/NADH ratio changes specifically in 5xFAD brain mitochondria. This was observed when mitochondria were respiring in the absence [Supplementary Figure 2B] or presence [Figure 2B] of ADP that mimics state 4 or state 3 respiration, respectively. No effect on FET was observed for CPT in WT control or 5xFAD animals. To further support the validity of the in vitro assays, we performed the RET and FET assays in the presence of rotenone. As expected, in the FET assays, rotenone induced ROS production in both WT and 5xFAD samples [Supplementary Figure 2C and D]. In the RET assays, rotenone inhibited ROS production only in 5xFAD samples [Supplementary Figure 2C and D]. We also included malonate, an inhibitor of succinate dehydrogenase, as a control in our assays. Malonate is expected to inhibit the production of CoQ10H2, a driving force of RET[32]. We found that malonate inhibited RET-ROS production, while having no observable effect on FET-ROS in 5xFAD samples [Supplementary Figure 2E and F]. Moreover, we found that whereas MMP, one of the driving forces of RET, was decreased in 5xFAD animals [Supplementary Figure 2G], the level of succinate, another driving force of RET[32], was significantly increased in 5xFAD samples and reduced by CPT treatment [Figure 2C]. These data suggest the accumulation of succinate, as previously observed in ischemia/reperfusion settings[32], is a potential driver of RET in AD. This is also consistent with our previous findings in aged flies that link succinate accumulation to the activation of RET[34].

Figure 2. In vivo efficacy of CPT in the 5xFAD mouse model of AD. (A and B) Measurements of NAD+/NADH ratio and H2O2 level in whole brain lysates (A) or purified mitochondria under in vitro RET and FET conditions (B) of wild-type control, and vehicle and CPT-treated 5xFAD mice; (C) Measurement of mitochondrial succinate level in non-transgenic wild-type control and 5xFAD mice treated with vehicle or CPT; (D) Measurements of clasping score in the hindlimb clasping assay on non-transgenic control and 5xFAD mice or 5xFAD mice treated with vehicle or CPT (50 mg/kg) by IP administration; (E) Immunostaining and data quantification of amyloid plaque load and number of microglia surrounding each plaque in the CA1 region of the hippocampus of vehicle or CPT-treated 5xFAD mouse brain; (F) Immunostaining and data quantification of C3-positive astrocytes in the CA1 region of the hippocampus of vehicle or CPT-treated 5xFAD mouse brain; **P < 0.01, ***P < 0.001 in Student’s t-test or one-way ANOVA test. CPT: CPT2008,
The 5xFAD mice presented with a positive hindlimb clasping reflex upon tail suspension[47], a neurological sign frequently observed in murine models of neurodegeneration[48-50]. CPT treatment effectively reduced the clasping index in 5xFAD mice [Figure 2D]. Microglial proliferation and activation in the brain is a prominent feature of AD. Various studies have revealed multiple states of microglial activation in disease settings, which likely underlie the disparate roles of microglia in the development and progression of AD[51]. We found that the vehicle-treated 5xFAD mice at 8 months of age developed full-blown amyloid plaques in the hippocampal CA1 region, surrounded by activated microglia [Figure 2E]. Similar results were obtained in other hippocampal regions and in the cortex (data not shown). CPT treatment effectively reduced amyloid load and the number of microglia surrounding each plaque. Astrogliosis, an abnormal increase of astrocytes associated with CNS trauma, infection, or neuroinflammation[52,53], was also evident in the hippocampal region of 5xFAD brain, as indicated by the increase of Complement 3 (C3)-positive disease-associated astrocytes[54]. This was also attenuated by CPT treatment [Figure 2F]. These results were consistent with the 2xTg AD mouse data shown earlier, and together, they demonstrated that inhibition of RET with CPT led to decreased amyloid burden and neuroinflammation and amelioration of behavioral deficits.
Efficacy of RET inhibition by CPT in human FAD iPSC-derived neuronal model of AD
We next sought to validate the role of RET in patient iPSC-derived neuronal models of AD. Using a method that facilitates the differentiation of iPSCs into cortical neurons through the introduction of the transcription factor Ngn2[36], we obtained human neurons from iPSCs carrying a familial AD (FAD) mutation involving APP duplication[55]. It was previously shown that compared to control neurons, the FAD iPSC-derived neurons exhibited higher ROS levels and a lower NAD+/NADH ratio, which were rescued by CPT treatment, suggesting that AD iPSC-derived neurons undergo active RET[34]. Key features of AD, such as amyloid aggregation, hyperphosphorylation of tau, and endolysosomal defects, have previously been recapitulated in patient iPSC-derived neurons[55-57]. We observed increased amyloid aggregation in AD iPSC neurons [Figure 3A], as detected with the mOC78 antibody[43], which recognizes a conformation-dependent and aggregation-specific discontinuous epitope of beta amyloid that maps to segments 8-11 (SGYE), 18-24 (VFFAEDV), and 26-32 (SNKGAII). mOC78 positive signals were significantly reduced by CPT treatment. We also observed increased tau phosphorylation in AD iPSC neurons, as detected with the CP13 monoclonal antibody that detects tau phosphorylated at serine-202[58]. CP13 positive p-tau signals were significantly reduced by CPT treatment [Figure 3B]. PHF-1 positive p-tau signals were also reduced by CPT treatment [Supplementary Figure 3]. However, no significant alteration in total tau level was observed [Figure 3C]. The neuronal endosomal-lysosomal system was found to be defective in AD patient samples and animal models, and endolysosomal dysfunction is emerging as one of the earliest pathological events in AD[59,60]. We observed enlarged early endosomes in AD iPSC neurons detected with the early endosome marker Rab5a. This defect was effectively rescued by CPT treatment [Figure 3D]. These data support the notion that RET activation is an early pathogenic event that precipitates key pathological features of AD.
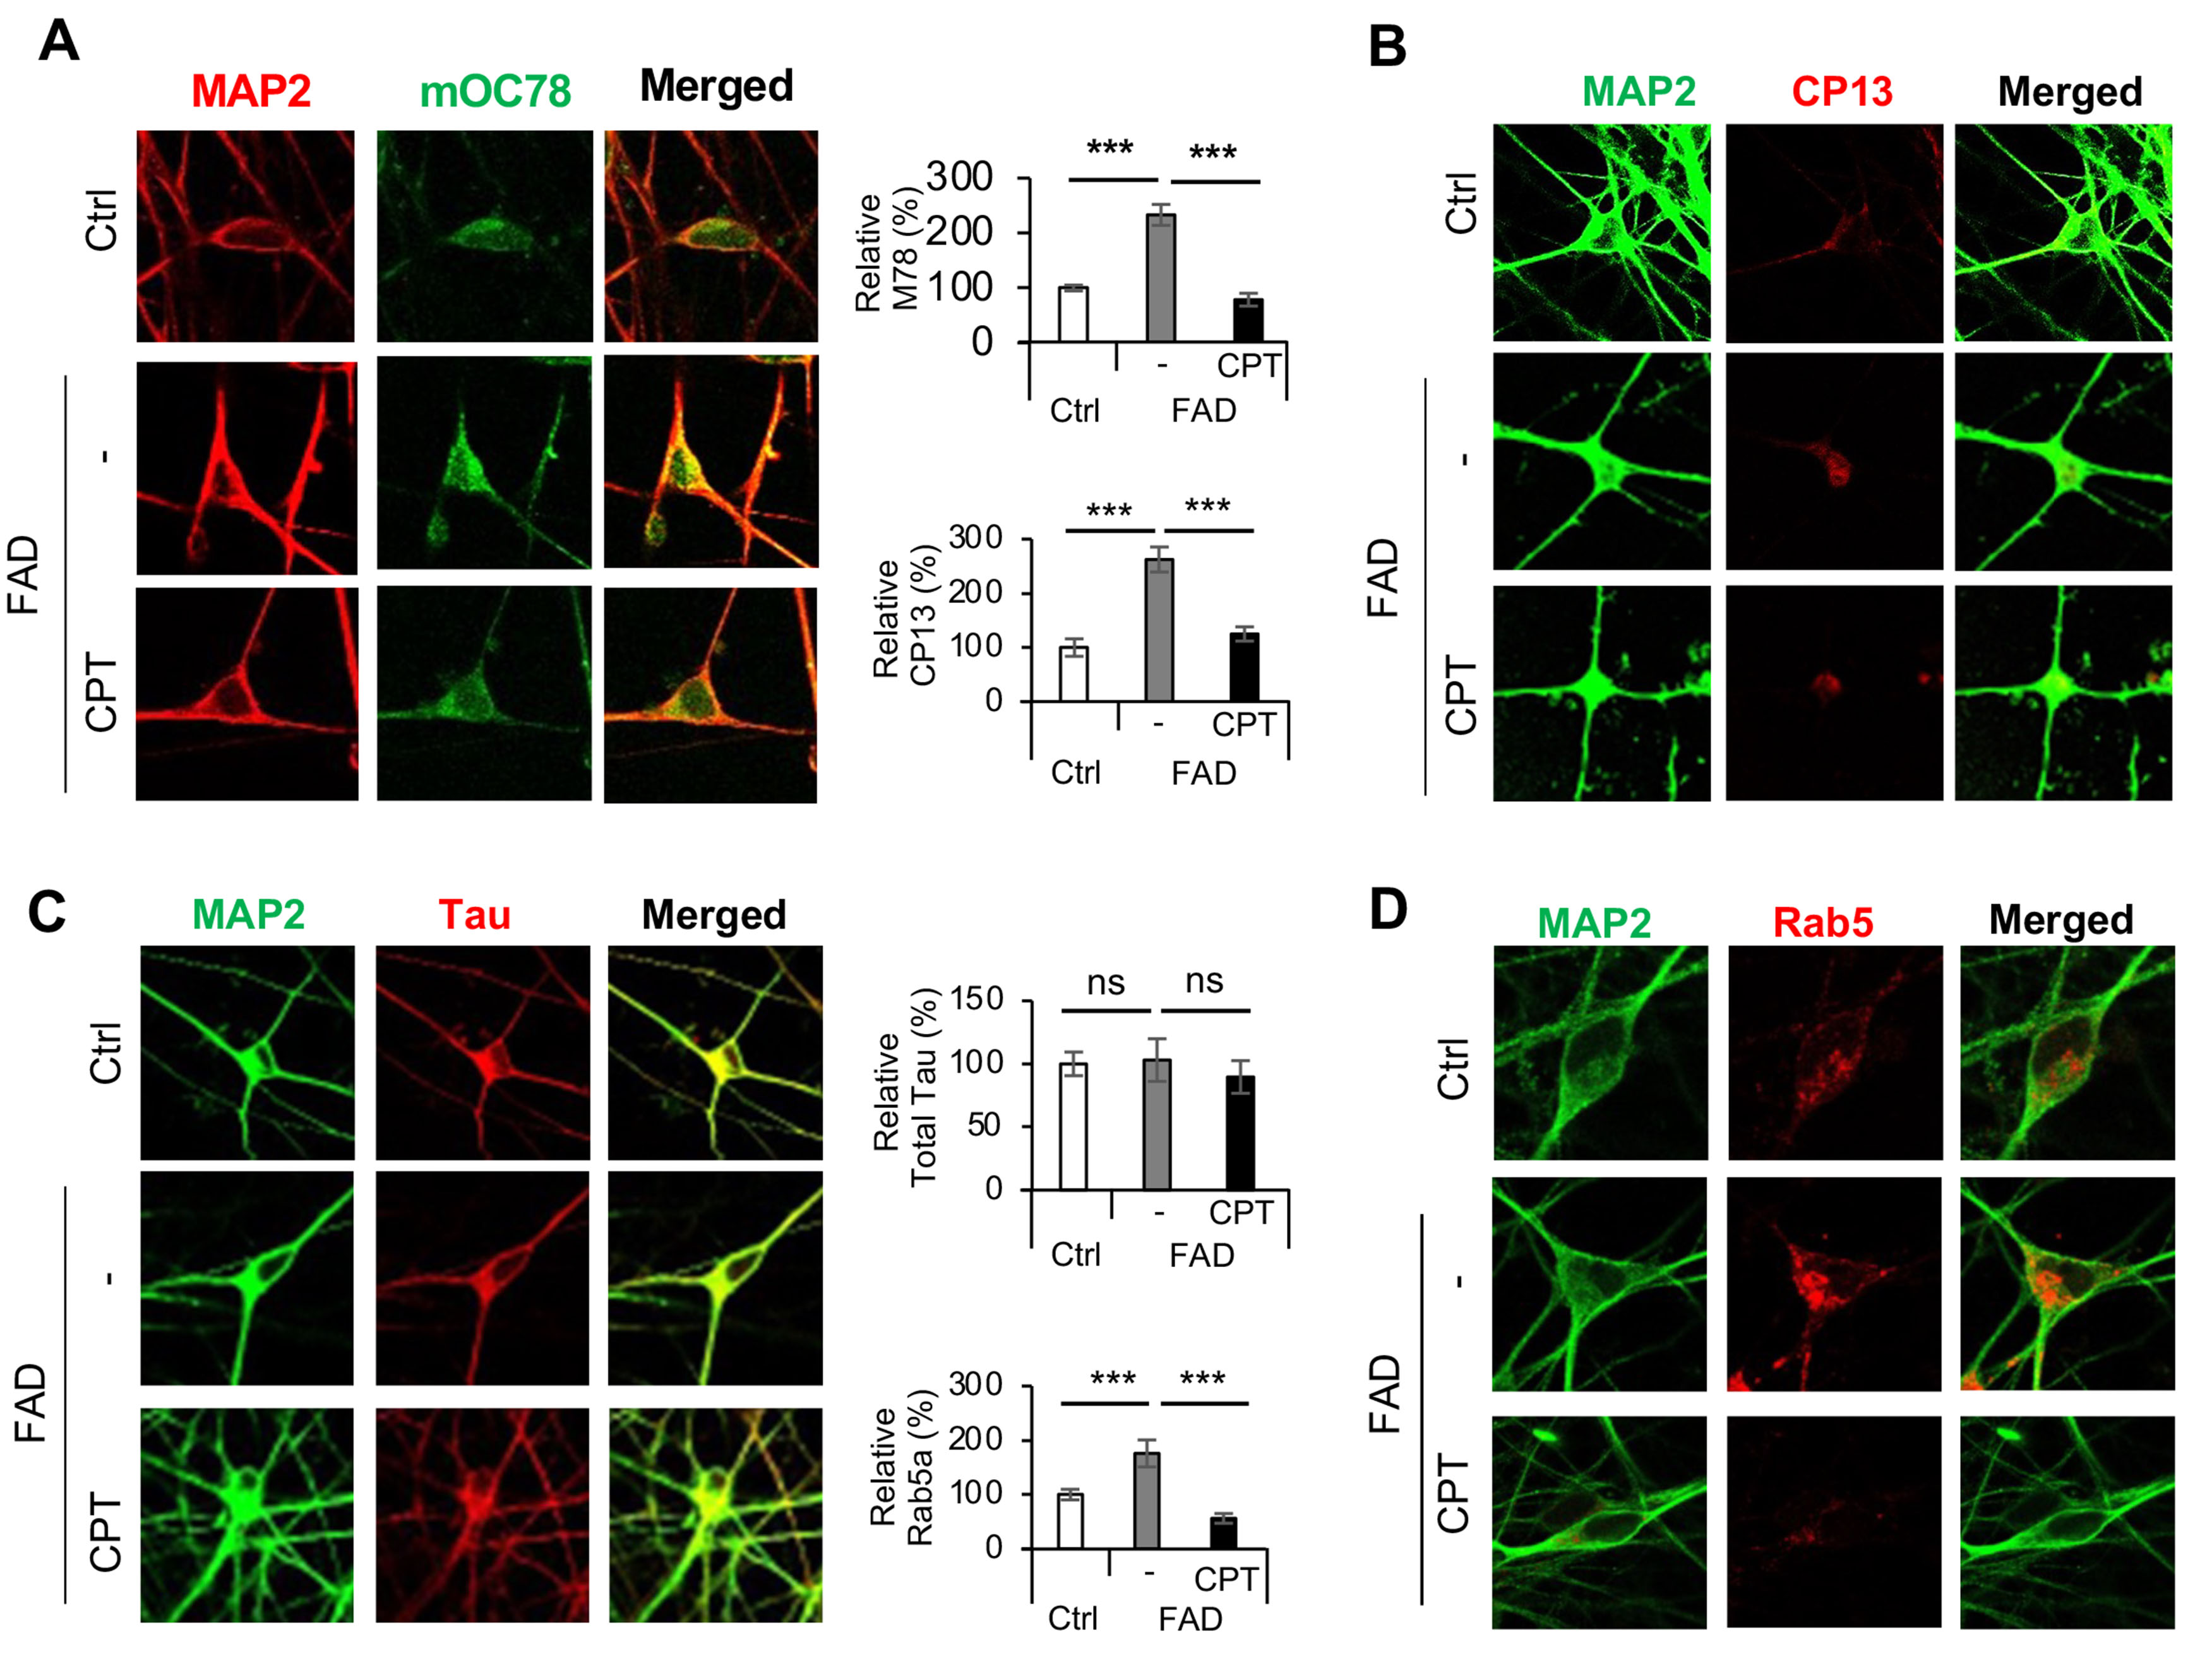
Figure 3. Effect of CPT on disease phenotypes in FAD iPSC derived neurons. (A) Immunostainings and data quantification showing the effect of CPT treatment on mOC78 positive beta-amyloid aggregates in control iPSC neurons and FAD iPSC neurons treated with vehicle or CPT; (B) Immunostainings and data quantification showing the effect of CPT treatment on CP13 positive p-tau signals in control iPSC neurons and FAD iPSC neurons treated with vehicle or CPT; (C) Immunostainings and data quantification showing the effect of CPT treatment on total tau signals in control iPSC neurons and FAD iPSC neurons treated with vehicle or CPT; (D) Immunostainings and data quantification showing the effect of CPT treatment on Rab5 positive early endosome signals in control iPSC neurons and FAD iPSC neurons treated with vehicle or CPT. ***P < 0.001, ns: not significant, in Student’s t-test or one-way ANOVA test. CPT: CPT2008, 6-chloro-3-(2,4-dichloro-5-methoxyphenyl)-2-mecapto-7-methoxyquinazolin-4(3H)-one; FAD: familial Alzheimer’s disease; iPSC: induced pluripotent stem cell.
RET is activated in AD and RET activation correlates with disease severity in AD
To further test the relevance of RET to AD pathology, we analyzed patient brain samples. Control and patient samples (n = 4 in each group), categorized according to the level of Alzheimer’s disease neuropathologic change (ADNC) - low, intermediate, or high, were used in our analysis [Supplementary Table 1]. When whole brain homogenates were analyzed, the decrease in NAD+/NADH ratio correlated well with ADNC levels, with the high ADNC group showing the most dramatic decrease in NAD+/NADH ratio [Figure 4A]. The ROS changes showed a similar trend but wider variation. This might be due to the different post-mortem intervals and handling of patient brain samples, which might have affected the preservation of the labile ROS signals. Analysis of oxidative protein damages showed that high ADNC patient mitochondrial samples suffered more oxidative damage [Supplementary Figure 4A], consistent with the increased ROS level we detected.
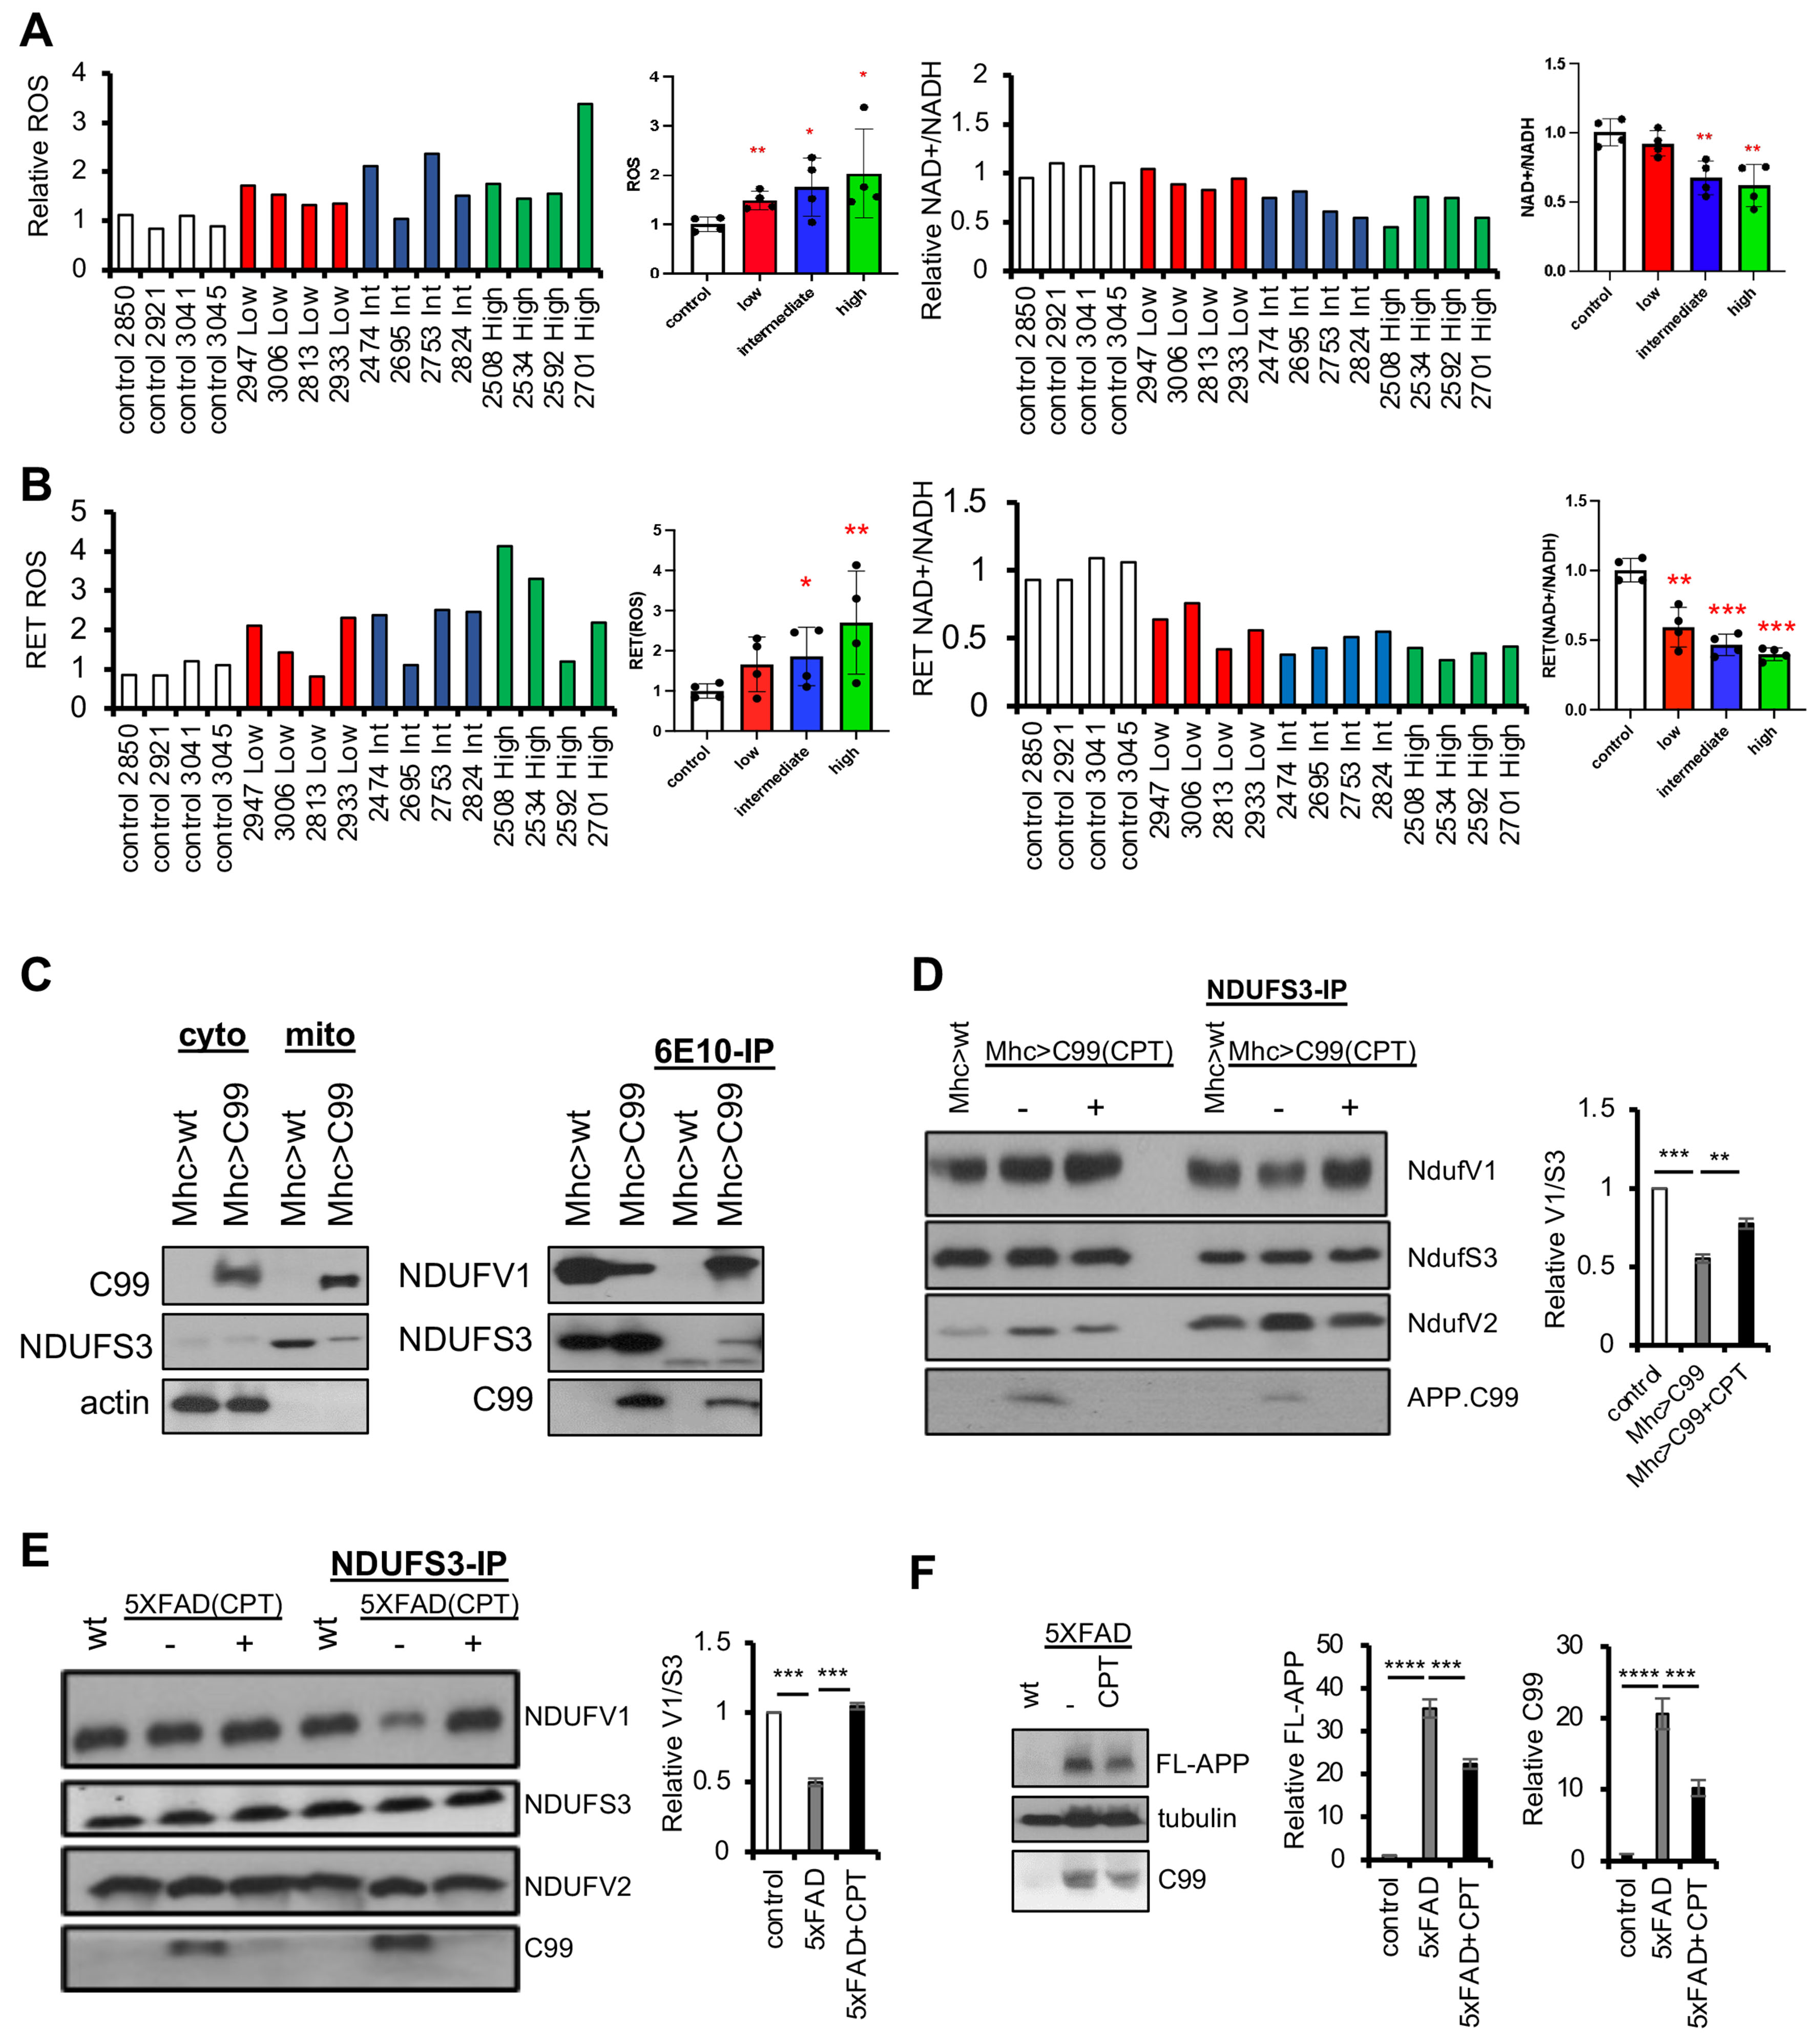
Figure 4. RET activation in human AD subjects and role of APP.C99 in RET deregulation in AD models. (A) Measurements of NAD+/NADH ratio and H2O2 level in brain tissue lysates of non-AD control, low ADNC, intermediate ADNC, and high ADNC individuals. Bar graphs show quantification of individual samples and pooled data from low, intermediate, and high ADNC samples; (B) In vitro RET assays using brain mitochondria purified from non-AD control, low ADNC, intermediate ADNC, and high ADNC individuals. Bar graphs show quantification of individual samples and pooled data from low, intermediate, and high ADNC samples; (C) Immunoblots showing presence of APP.C99 in mitochondrial fraction and co-IP assay showing physical interaction between APP.C99 and NDUFV1 and NDUFS3; (D) Co-IP assay and data quantification showing altered NDUFS3 interaction with NDUFV1 in APP.C99 transgenic flies and the effect of CPT treatment in restoring such interaction; (E) Co-IP assay and data quantification showing altered NDUFS3 interaction with NDUFV1 in 5xFAD transgenic mouse brain tissues and the effect of CPT treatment in restoring such interaction; (F) Immunoblots and data quantification showing the effect of CPT treatment on full-length APP and APP.C99 levels in 5xFAD transgenic mouse brain tissues. *P < 0.05, **P < 0.01, ***P < 0.001 in Student’s t-test or one-way ANOVA test. AD: Alzheimer’s disease; RET: reverse electron transport; ADNC: Alzheimer’s disease neuropathologic change; CPT: CPT2008, 6-chloro-3-(2,4-dichloro-5-methoxyphenyl)-2-mecapto-7-methoxyquinazolin-4(3H)-one; FAD: familial Alzheimer’s disease.
Next, we purified mitochondria from control, low ADNC, intermediate ADNC, and high ADNC frozen brain samples and used them in in vitro RET and FET assays. We first confirmed that the purified mitochondria were functional by showing that they exhibit comparable CCCP-sensitive MMP, with high ADNC samples showing a slight decrease in MMP [Supplementary Figure 4B], and that upon rotenone treatment under complex I-coupled FET condition, FET-ROS was increased [Supplementary Figure 4C], suggesting that these mitochondria were respiring in vitro and thus were functional. Analysis of purified mitochondria showed that whereas the FET activity was comparable between the samples [Supplementary Figure 4D], RET activity as measured by RET-ROS increase and NAD+/NADH ratio decrease was greater in AD samples with higher ADNC levels [Figure 4B]. These data support the notion that RET is activated early in AD patient brain and RET activity positively correlates with disease severity.
Protein-protein interaction mediating RET is altered by APP.C99 in AD models
Finally, we used different animal models to explore the mechanism by which RET is deregulated in AD. First, we used transgenic flies expressing APP.C99, the C-terminal fragment of APP that has been shown to be localized to mitochondria and mitochondria-ER contact sites[61] and is emerging as an etiological driver of AD[62,63]. Our previous studies showed that RET is activated in APP.C99 Tg flies[34]. We found that APP.C99 interacted with NDUFS3 and NDUFV1 [Figure 4C], components of the RET machinery[33,34]. Moreover, the interaction between NDUFS3 and NDUFV1 was weakened, whereas NDUFS3-NDUFV2 interaction enhanced, in APP.C99 transgenic flies [Figure 4D and Supplementary Figure 4E]. The observation of APP.C99 interaction with complex I components is consistent with previous findings of APP.C99 association with mitochondria[61], although APP.C99 interaction with complex I has never been shown before. Thus, like Notch in cancer settings[33], APP.C99 is promoting RET presumably by directly interacting with components of the RET machinery and altering protein-protein interactions that likely reflect altered complex I conformation. Moreover, as in aging setting, where altered protein-protein interactions involving NDUFS3, NDUFV1, and NDUFV2 associated with RET activation were restored by CPT treatment[34], CPT treatment also restored these protein-protein interactions in APP.C99 model flies
DISCUSSION
In this study, using mouse models, patient brain samples, and patient iPSC-derived neuronal models of AD, we have demonstrated that RET is aberrantly activated in the disease process, and that pharmacological inhibition of RET is therapeutically beneficial in two well-characterized genetic mouse models of AD. Previous studies showed that RET is activated during normal aging, and that its inhibition promotes healthspan and lifespan in Drosophila[34]. Although a previous study concluded that RET-ROS promoted fly lifespan, the study was based largely on the observation that transgenic expression of a mitochondrial-targeted Catalase (mito-CAT) shortened fly lifespan[64]. However, the role of mito-ROS on lifespan is controversial, as mito-CAT has been shown to extend lifespan in mice[65], and treatment of flies with a mitochondrial targeted antioxidant Mito-TEMPO actually extended fly lifespan[34]. Thus, even if RET-ROS exerts some poorly understood positive effect on lifespan, this effect may have been masked by the detrimental effect of mitochondrial NAD+/NADH ratio drop caused by RET, resulting in a net negative effect of RET on aging and age-related diseases[31]. Together, these results are consistent with the geroscience approach to health, which posits that chronic age-related diseases and aging share common underlying biological mechanisms[66,67]. Our data support that aberrant RET activation is a driver of aging and age-related diseases. Inhibition of RET by CPT simultaneously restored two key parameters associated with aging and age-related diseases: mito-ROS and NAD+/NADH ratio, explaining the efficacy of CPT under various pathological conditions reported here and previously[31,33,34]. CPT possesses desirable drug-like properties, including oral bioavailability, efficient BBB penetration, reasonable stability (T1/2 of 4 and 7 h in the plasma and brain, respectively, upon iv injection), and wide tissue distribution. The fact that APP/PS1 animals well tolerated daily CPT treatment for 4 months with no tissue abnormality upon necropsy and that animals showed body weight gain towards the end of treatment support the safety of CPT. CPT also tested negative in the Ames mutagenesis genotoxicity assay and showed a relatively clean profile in the safety screen for common kinase, receptor, and ion channel targets associated with clinical adverse effects. However, as a small molecule, possible non-RET-related targets of CPT cannot be excluded at this point. Future safety studies in larger animals and a better understanding of the normal physiological role of RET in humans will be required before CPT and new RET inhibitors can be translated to clinical settings.
The molecular players involved in RET functioning and regulation are just beginning to be revealed. Previous studies implicated complex I subunits within the soluble matrix arm of the L-shaped multi-subunit complex in the RET process[33]. Intriguingly, these complex I proteins shown to interact with CPT or participate in RET are downregulated in long-lived mammals[68], and their partial but not complete knockdown in worms[69,70] or flies[71,72] extended lifespan, supporting the importance of RET in aging[73]. This is consistent with the identification of altered expression of a cluster of electron transport chain genes as a shared aging signature across species and across tissues in humans[74]. In both aging and AD settings, the interaction between NDUFS3 and other proteins involved in RET, such as NDUFV1, was reduced in RET activation condition, and CPT treatment restored such interactions. In cancer cells, oncogenic Notch was previously shown to compete with NDUFS3 for binding to NDUFV1[33]. In AD setting, our data suggest that APP.C99 may compete with NDUFS3 for NDUFV1 interaction. In both cases, inhibition of RET by CPT treatment is correlated with restoration of NDUFS3-NDUFV1 interaction. These data suggest that aberrant RET activation in aging or age-related disease settings is associated with conformational changes in complex I, and CPT acts by restoring such conformational changes. Future cryo-EM and molecular dynamics simulation studies on complex I in different RET states will help understand the structural basis of this RET regulation and its effect on the directionality of electron transport.
Our results also suggest that RET is activated early in the disease process in humans and thus may play a central pathogenic role in AD. APP.C99, the emerging etiological driver of AD, directly interacts with the mitochondrial machinery to promote RET. Importantly, our data also indicate that RET, in turn, promotes proteostasis failure in AD, as shown by the reduction of amyloid burden in CPT-treated animals. This is consistent with our previous findings that the amyloid burden in AD may originate from aberrant ribosome-associated quality control (RQC) of APP/APP.C99[75], and that RET is connected to the RQC of APP.C99, as shown by the reduction of aberrant APP.C99 translational quality control products by CPT[34]. These data suggest that there exists a feedforward loop between RET activation and proteostasis failure caused by aberrant RQC of APP.C99 in AD pathogenesis. Pharmacological inhibition of RET with CPT breaks this vicious cycle, offering a novel therapeutic strategy for AD and possibly other age-related diseases including aging itself.
Our results also implicate the accumulation of succinate, which can be converted to CoQH2, a driving force of RET, as a potential contributor of RET deregulation in AD. This is consistent with previous findings of succinate accumulation in normal aged flies and AD model flies[34]. Succinate accumulation has previously been shown to be a key driver of RET-ROS that causes ischemia/reperfusion injury[32]. Future studies of the cause of succinate accumulation may lead to new insights into aging and age-related diseases.
In summary, in the current study, we used two models of transgenic mice carrying AD-associated pathogenic mutations and exhibiting AD-relevant neuropathology and cognitive deficits to study the involvement of RET in AD pathogenesis and the mechanism of RET alteration in AD. We show that (1) RET is aberrantly activated in vivo in APP/PS1 and 5xFAD mice; (2) Using human samples, we show for the first time that RET is activated in AD patient brains, and that the degree of RET activation correlates with disease severity; (3) We show that RET inhibition with CPT can effectively rescue AD-related neuropathology and cognitive deficits in the APP/PS1 and 5xFAD models; (4) We show that RET inhibition with CPT can effectively rescue AD-related neuropathology in human iPSC-derived AD model; (5) We elucidate the mechanism of RET deregulation in AD by showing that the APP metabolite APP.C99 can promote RET by entering mitochondria and interacting with mitochondrial complex I components involved in RET. These findings have important implications for our understanding of the disease mechanism and therapeutic intervention of Alzheimer’s disease and other age-related neurodegenerative diseases.
DECLARATIONS
Acknowledgments
We are grateful to Dr. Edward Owusu-Ansah, Charles Glabe, and Peter Davies for antibodies, the Vienna Drosophila RNAi Center, FlyORF, and the Bloomington Drosophila Stock Center for fly stocks; The Axelrod, Bogyo, Boyd, Cobos, and Svensson Labs in the Department of Pathology, Stanford University School of Medicine for sharing reagents and equipment. Special thanks go to J. Gaunce for maintaining fly stocks and providing technical support, and members of the Lu lab for discussions.
Author contributions
Designed experiments, analyzed data, and prepared the manuscripts: Rimal S
Performed experiments and analyzed data: Li W, Khaket TP, Li Y (Yu Li), Tantray I, Li Y (Yanping Li), Bhurtel S
Provided reagents: Grinberg LT, Spina S, Sillero MIC, Seeley WW, Guo S
Conceived the study, designed experiment, performed experiments, wrote the manuscript, and provided funding: Lu B
Availability of data and materials
Not applicable.
Financial support and sponsorship
This work was supported by the NIH (R01NS083417, R01NS084412, and R21AG083863 to BL).
Conflicts of interest
Lu B and Guo S are cofounders of Cerepeut, Inc. and serve on its scientific advisory board. Other authors had no conflicts of interest.
Ethical approval and consent to participate
All animal experiments were performed in accordance with the protocols approved by the Administrative Panel on Laboratory Animal Care (APLAC) at Stanford University and comply with all regulations for the ethical conduct of animal research.
Consent for publication
Not applicable.
Copyright
© The Author(s) 2024.
Supplementary Materials
REFERENCES
1. Albers DS, Flint Beal M. Mitochondrial dysfunction and oxidative stress in aging and neurodegenerative disease. J Neural Transm Suppl 2000;59:133-54.
2. Tönnies E, Trushina E. Oxidative stress, synaptic dysfunction, and Alzheimer’s disease. J Alzheimers Dis 2017;57:1105-21.
3. Rummel NG, Butterfield DA. Altered metabolism in Alzheimer disease brain: role of oxidative stress. Antioxid Redox Signal 2022;36:1289-305.
4. Gómez J, Mota-Martorell N, Jové M, Pamplona R, Barja G. Mitochondrial ROS production, oxidative stress and aging within and between species: evidences and recent advances on this aging effector. Exp Gerontol 2023;174:112134.
5. Lautrup S, Sinclair DA, Mattson MP, Fang EF. NAD+ in brain aging and neurodegenerative disorders. Cell Metab 2019;30:630-55.
6. Rajman L, Chwalek K, Sinclair DA. Therapeutic potential of NAD-boosting molecules: the in vivo evidence. Cell Metab 2018;27:529-47.
7. Covarrubias AJ, Perrone R, Grozio A, Verdin E. NAD+ metabolism and its roles in cellular processes during ageing. Nat Rev Mol Cell Biol 2021;22:119-41.
8. Katsyuba E, Romani M, Hofer D, Auwerx J. NAD+ homeostasis in health and disease. Nat Metab 2020;2:9-31.
10. Liguori I, Russo G, Curcio F, et al. Oxidative stress, aging, and diseases. Clin Interv Aging 2018;13:757-72.
11. Edeas M. [Anti-oxidants, controversies and perspectives: how can the failure of clinical studies using anti-oxidants be explained? J Soc Biol 2009;203:271-80.
12. Suzuki K. Anti-oxidants for therapeutic use: why are only a few drugs in clinical use? Adv Drug Deliv Rev 2009;61:287-9.
13. Blanco-Vaca F, Rotllan N, Canyelles M, Mauricio D, Escolà-Gil JC, Julve J. NAD+-increasing strategies to improve cardiometabolic health? Front Endocrinol 2021;12:815565.
14. Poljšak B, Kovač V, Milisav I. Current uncertainties and future challenges regarding NAD+ boosting strategies. Antioxidants 2022;11:1637.
15. Barja G. The mitochondrial free radical theory of aging. Prog Mol Biol Transl Sci 2014;127:1-27.
16. Harman D. Aging: a theory based on free radical and radiation chemistry. J Gerontol 1956;11:298-300.
17. Castejon-Vega B, Cordero MD, Sanz A. How the disruption of mitochondrial redox signalling contributes to ageing. Antioxidants 2023;12:831.
18. Holmström KM, Finkel T. Cellular mechanisms and physiological consequences of redox-dependent signalling. Nat Rev Mol Cell Biol 2014;15:411-21.
19. Orrenius S. Reactive oxygen species in mitochondria-mediated cell death. Drug Metab Rev 2007;39:443-55.
20. Wong HS, Dighe PA, Mezera V, Monternier PA, Brand MD. Production of superoxide and hydrogen peroxide from specific mitochondrial sites under different bioenergetic conditions. J Biol Chem 2017;292:16804-9.
21. Barja G. Mitochondrial free radical production and aging in mammals and birds. Ann N Y Acad Sci 1998;854:224-38.
23. Scialò F, Fernández-Ayala DJ, Sanz A. Role of mitochondrial reverse electron transport in ROS signaling: potential roles in health and disease. Front Physiol 2017;8:428.
24. Chini CCS, Zeidler JD, Kashyap S, Warner G, Chini EN. Evolving concepts in NAD+ metabolism. Cell Metab 2021;33:1076-87.
26. Houtkooper RH, Pirinen E, Auwerx J. Sirtuins as regulators of metabolism and healthspan. Nat Rev Mol Cell Biol 2012;13:225-38.
27. Bonkowski MS, Sinclair DA. Slowing ageing by design: the rise of NAD+ and sirtuin-activating compounds. Nat Rev Mol Cell Biol 2016;17:679-90.
28. Mouchiroud L, Houtkooper RH, Moullan N, et al. The NAD+/sirtuin pathway modulates longevity through activation of mitochondrial UPR and FOXO signaling. Cell 2013;154:430-41.
29. Murphy MP. Understanding and preventing mitochondrial oxidative damage. Biochem Soc Trans 2016;44:1219-26.
30. Chouchani ET, Pell VR, James AM, et al. A unifying mechanism for mitochondrial superoxide production during ischemia-reperfusion injury. Cell Metab 2016;23:254-63.
31. Chavda V, Lu B. Reverse electron transport at mitochondrial complex I in ischemic stroke, aging, and age-related diseases. Antioxidants 2023;12:895.
32. Chouchani ET, Pell VR, Gaude E, et al. Ischaemic accumulation of succinate controls reperfusion injury through mitochondrial ROS. Nature 2014;515:431-5.
33. Ojha R, Tantray I, Rimal S, Mitra S, Cheshier S, Lu B. Regulation of reverse electron transfer at mitochondrial complex I by unconventional Notch action in cancer stem cells. Dev Cell 2022;57:260-76.e9.
34. Rimal S, Tantray I, Li Y, et al. Reverse electron transfer is activated during aging and contributes to aging and age-related disease. EMBO Rep 2023;24:e55548.
35. Onukwufor JO, Berry BJ, Wojtovich AP. Physiologic implications of reactive oxygen species production by mitochondrial complex I reverse electron transport. Antioxidants 2019;8:285.
36. Zhang Y, Pak C, Han Y, et al. Rapid single-step induction of functional neurons from human pluripotent stem cells. Neuron 2013;78:785-98.
37. Jankowsky JL, Slunt HH, Gonzales V, Jenkins NA, Copeland NG, Borchelt DR. APP processing and amyloid deposition in mice haplo-insufficient for presenilin 1. Neurobiol Aging 2004;25:885-92.
38. Garcia-Alloza M, Robbins EM, Zhang-Nunes SX, et al. Characterization of amyloid deposition in the APPswe/PS1dE9 mouse model of Alzheimer disease. Neurobiol Dis 2006;24:516-24.
39. Kamphuis W, Orre M, Kooijman L, Dahmen M, Hol EM. Differential cell proliferation in the cortex of the APPswePS1dE9 Alzheimer’s disease mouse model. Glia 2012;60:615-29.
40. Janus C, Flores AY, Xu G, Borchelt DR. Behavioral abnormalities in APPSwe/PS1dE9 mouse model of AD-like pathology: comparative analysis across multiple behavioral domains. Neurobiol Aging 2015;36:2519-32.
41. Lalonde R, Kim HD, Maxwell JA, Fukuchi K. Exploratory activity and spatial learning in 12-month-old APP695SWE/co+PS1/ΔE9 mice with amyloid plaques. Neurosci Lett 2005;390:87-92.
42. Volianskis A, Køstner R, Mølgaard M, Hass S, Jensen MS. Episodic memory deficits are not related to altered glutamatergic synaptic transmission and plasticity in the CA1 hippocampus of the APPswe/PS1ΔE9-deleted transgenic mice model of β-amyloidosis. Neurobiol Aging 2010;31:1173-87.
43. Hatami A, Albay R 3rd, Monjazeb S, Milton S, Glabe C. Monoclonal antibodies against Aβ42 fibrils distinguish multiple aggregation state polymorphisms in vitro and in Alzheimer disease brain. J Biol Chem 2014;289:32131-43.
44. Ito D, Imai Y, Ohsawa K, Nakajima K, Fukuuchi Y, Kohsaka S. Microglia-specific localisation of a novel calcium binding protein, Iba1. Brain Res Mol Brain Res 1998;57:1-9.
45. Manczak M, Kandimalla R, Yin X, Reddy PH. Hippocampal mutant APP and amyloid beta-induced cognitive decline, dendritic spine loss, defective autophagy, mitophagy and mitochondrial abnormalities in a mouse model of Alzheimer’s disease. Hum Mol Genet 2018;27:1332-42.
46. Oakley H, Cole SL, Logan S, et al. Intraneuronal beta-amyloid aggregates, neurodegeneration, and neuron loss in transgenic mice with five familial Alzheimer’s disease mutations: potential factors in amyloid plaque formation. J Neurosci 2006;26:10129-40.
47. O’Leary TP, Robertson A, Chipman PH, Rafuse VF, Brown RE. Motor function deficits in the 12 month-old female 5xFAD mouse model of Alzheimer’s disease. Behav Brain Res 2018;337:256-63.
48. Cahill LS, Zhang MA, Ramaglia V, et al. Aged hind-limb clasping experimental autoimmune encephalomyelitis models aspects of the neurodegenerative process seen in multiple sclerosis. Proc Natl Acad Sci U S A 2019;116:22710-20.
49. Stack EC, Dedeoglu A, Smith KM, et al. Neuroprotective effects of synaptic modulation in Huntington’s disease R6/2 mice. J Neurosci 2007;27:12908-15.
50. Yasui DH, Gonzales ML, Aflatooni JO, et al. Mice with an isoform-ablating Mecp2 exon 1 mutation recapitulate the neurologic deficits of Rett syndrome. Hum Mol Genet 2014;23:2447-58.
51. Deczkowska A, Keren-Shaul H, Weiner A, Colonna M, Schwartz M, Amit I. Disease-associated microglia: a universal immune sensor of neurodegeneration. Cell 2018;173:1073-81.
52. Pekny M, Pekna M. Reactive gliosis in the pathogenesis of CNS diseases. Biochim Biophys Acta 2016;1862:483-91.
53. Birch AM. The contribution of astrocytes to Alzheimer’s disease. Biochem Soc Trans 2014;42:1316-20.
54. Liddelow SA, Guttenplan KA, Clarke LE, et al. Neurotoxic reactive astrocytes are induced by activated microglia. Nature 2017;541:481-7.
55. Israel MA, Yuan SH, Bardy C, et al. Probing sporadic and familial Alzheimer’s disease using induced pluripotent stem cells. Nature 2012;482:216-20.
56. Kwart D, Gregg A, Scheckel C, et al. A large panel of isogenic APP and PSEN1 mutant human iPSC neurons reveals shared endosomal abnormalities mediated by APP β-CTFs, not Aβ. Neuron 2019;104:256-70.e5.
57. Muratore CR, Rice HC, Srikanth P, et al. The familial Alzheimer’s disease APPV717I mutation alters APP processing and Tau expression in iPSC-derived neurons. Hum Mol Genet 2014;23:3523-36.
58. d’Abramo C, Acker CM, Jimenez H, Davies P. Passive immunization in JNPL3 transgenic mice using an array of phospho-tau specific antibodies. PLoS One 2015;10:e0135774.
59. Colacurcio DJ, Pensalfini A, Jiang Y, Nixon RA. Dysfunction of autophagy and endosomal-lysosomal pathways: roles in pathogenesis of Down syndrome and Alzheimer’s disease. Free Radic Biol Med 2018;114:40-51.
60. Nixon RA. Amyloid precursor protein and endosomal-lysosomal dysfunction in Alzheimer’s disease: inseparable partners in a multifactorial disease. FASEB J 2017;31:2729-43.
61. Pera M, Larrea D, Guardia-Laguarta C, et al. Increased localization of APP-C99 in mitochondria-associated ER membranes causes mitochondrial dysfunction in Alzheimer disease. EMBO J 2017;36:3356-71.
62. Lauritzen I, Pardossi-Piquard R, Bourgeois A, Bécot A, Checler F. Does intraneuronal accumulation of carboxyl-terminal fragments of the amyloid precursor protein trigger early neurotoxicity in Alzheimer’s disease? Curr Alzheimer Res 2019;16:453-7.
63. Pera M, Montesinos J, Larrea D, et al. Chapter Nine - MAM and C99, key players in the pathogenesis of Alzheimer’s disease. Int Rev Neurobiol 2020;154:235-78.
64. Scialò F, Sriram A, Fernández-Ayala D, et al. Mitochondrial ROS produced via reverse electron transport extend animal lifespan. Cell Metab 2016;23:725-34.
65. Schriner SE, Linford NJ, Martin GM, et al. Extension of murine life span by overexpression of catalase targeted to mitochondria. Science 2005;308:1909-11.
66. Campisi J, Kapahi P, Lithgow GJ, Melov S, Newman JC, Verdin E. From discoveries in ageing research to therapeutics for healthy ageing. Nature 2019;571:183-92.
67. Seals DR, Justice JN, LaRocca TJ. Physiological geroscience: targeting function to increase healthspan and achieve optimal longevity. J Physiol 2016;594:2001-24.
68. Miwa S, Jow H, Baty K, et al. Low abundance of the matrix arm of complex I in mitochondria predicts longevity in mice. Nat Commun 2014;5:3837.
69. Dillin A, Hsu AL, Arantes-Oliveira N, et al. Rates of behavior and aging specified by mitochondrial function during development. Science 2002;298:2398-401.
70. Lee SS, Lee RY, Fraser AG, Kamath RS, Ahringer J, Ruvkun G. A systematic RNAi screen identifies a critical role for mitochondria in C. elegans longevity. Nat Genet 2003;33:40-8.
71. Copeland JM, Cho J, Lo T Jr, et al. Extension of Drosophila life span by RNAi of the mitochondrial respiratory chain. Curr Biol 2009;19:1591-8.
72. Owusu-Ansah E, Song W, Perrimon N. Muscle mitohormesis promotes longevity via systemic repression of insulin signaling. Cell 2013;155:699-712.
Cite This Article
Export citation file: BibTeX | RIS
OAE Style
Rimal S, Li W, Khaket TP, Li Y, Tantray I, Li Y, Bhurtel S, Grinberg LT, Spina S, Sillero MIC, Seeley WW, Guo S, Lu B. Deregulation of mitochondrial reverse electron transport alters the metabolism of reactive oxygen species and NAD+/NADH and presents a therapeutic target in Alzheimer's disease. Ageing Neur Dis 2024;4:4. http://dx.doi.org/10.20517/and.2024.07
AMA Style
Rimal S, Li W, Khaket TP, Li Y, Tantray I, Li Y, Bhurtel S, Grinberg LT, Spina S, Sillero MIC, Seeley WW, Guo S, Lu B. Deregulation of mitochondrial reverse electron transport alters the metabolism of reactive oxygen species and NAD+/NADH and presents a therapeutic target in Alzheimer's disease. Ageing and Neurodegenerative Diseases. 2024; 4(1): 4. http://dx.doi.org/10.20517/and.2024.07
Chicago/Turabian Style
Rimal, Suman, Wen Li, Tejinder Pal Khaket, Yu Li, Ishaq Tantray, Yanping Li, Sunil Bhurtel, Lea T Grinberg, Salvatore Spina, Maria Inmaculada Cobos Sillero, William W Seeley, Su Guo, Bingwei Lu. 2024. "Deregulation of mitochondrial reverse electron transport alters the metabolism of reactive oxygen species and NAD+/NADH and presents a therapeutic target in Alzheimer's disease" Ageing and Neurodegenerative Diseases. 4, no.1: 4. http://dx.doi.org/10.20517/and.2024.07
ACS Style
Rimal, S.; Li W.; Khaket TP.; Li Y.; Tantray I.; Li Y.; Bhurtel S.; Grinberg LT.; Spina S.; Sillero MIC.; Seeley WW.; Guo S.; Lu B. Deregulation of mitochondrial reverse electron transport alters the metabolism of reactive oxygen species and NAD+/NADH and presents a therapeutic target in Alzheimer's disease. Ageing. Neur. Dis. 2024, 4, 4. http://dx.doi.org/10.20517/and.2024.07
About This Article
Copyright

Data & Comments
Data
0

 Cite This Article 6 clicks

 Like This Article 8
likes
Like This Article 8
likes


Comments
Comments must be written in English. Spam, offensive content, impersonation, and private information will not be permitted. If any comment is reported and identified as inappropriate content by OAE staff, the comment will be removed without notice. If you have any queries or need any help, please contact us at support@oaepublish.com.